Biomass
CHAPTER I
INTRODUCTION
1.1 Background
Ecosystems have unequal
productivity. The conversion speed from light energy to chemical energy in an
ecosystem called primary productivity. Productivity within the terrestrial
environment is affected by sediment, heat, light intensity, the length of the
season, the mineral content, and the supply of carbon dioxide, which is
influenced by sunlight by observing the light intensity, temperature and
mineral availability (Zulkifli, 2010). Vegetation is a vegetation in its broadest
sense. In general, the plant consists of several classes, among others, a tree
that is in the form of a stand with certain characteristics. Then can be found
bushes and others depending on the observed ecosystem. (Odum, 1993).
The spread of a plant species
is indirectly influenced by interactions between vegetation with temperature,
humidity, and topography conditions such as altitude and and soil depth.
Sutaryo (2009) states that in certain environmental conditions each plant
species is dispersed with varying levels of adaptation, thus leading to the
presence or absence of a plant environment type in the environment (Ewusia,
1990).
Biomass is a useful and
accessible measure, but it does not provide clues to population dynamics.
Ecologists are attracted to productivity because if the dry weight of a
community can be determined at a given time and the rate of dry weight changes
can be measured, the data can be converted into energy transfer through an
ecosystem. Using this information different ecosystems can be compared and the
relative efficiency for changes in solar irradiance into organic matter can be
calculated (Indriyanto, 2006).
Forests are natural
resources that constitute an ecosystem, within this ecosystem, there is a
mutual relationship between individuals and their environment. The growing
environment of plants represents a growing environment of plants is a complex
system, in which the various factors interact and fall into each other against
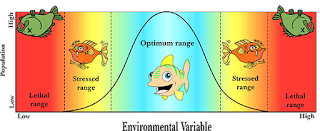
the vegetation. Growth and development is a response of plants to environmental
factors where the plant will respond according to tolerance limits possessed by
these plants against these environmental factors (Indriyanto, 2006).
Plant biomass increases
as plants absorb carbon dioxide (CO2) from the air and convert this substance
into organic matter through photosynthesis. Unlike animals, plants make their
own food called primary productivity which is divided into net primary
productivity and gross primary productivity (Heddy, et al., 1986).The primary
productivity of the gross is the total rate of photosynthesis, including the
spent organic matter used in respiration during measurement time. This is also
known as total photosynthesis or total assimilation. While net primary
productivity is the rate of storage of organic matter in plant tissues during
measurement time. So the keyword from the above definition is the rate, where
the time element must be considered, ie the amount of time energy tied up
within a certain time (Heddy, et al., 1986).
Given
the large role of organic matter in improving soil productivity, it is
necessary to locate potential and locally available sources of organic
material. The potential source of organic material as a nutrient provider is a
high quality organic material that has a C / N ratio. Usually people in dry
land utilize organic material sources derived from their agricultural business
such as crop residues or legume crop residues. But the availability of organic
matter from this source is limited because it is used also as animal feed
(Odum, 1993).
1.2 Problem Formulation
Based on the above background, the following is the formulation of
the problem proposed in this study.
1.2.1
How to measure plant biomass?
1.2.2
How is biomass of lower plants per
unit of time for overall biomass?
1.3 Purpose
Based on the formulation of the problems that have been proposed, the
following is the purpose of this research, namely to:
1.3.1
Know how to measure plant biomass.
1.3.2
Knowing the biomass of the lower plants
per unit time for the overall biomass
1.4 Usability Research
1.4.1 For Researchers
a.
As a means of training in conducting
research in the field of ecology.
b.
To increase the knowledge of the
biomass of the lower plants per unit time for the overall biomass.
1.4.2 For Students
a.
This research is expected to help
develop ecological disciplines in various studies.
b.
For learning media for students and
add insight of students' knowledge about biomass
c.
For comparison materials in doing
further research.
1.5 Limitations of Research
The
limitations in this study are.
1.5.1
This study is only conducted on the lower plants
1.5.2
The time interval used for the cutting process is three days.
1.5.3
The time interval used for the process of applying is three days.
1.6. Operational definition
1.6.1 Biomass is a term for the weight of living material, usually
expressed as dry weight, for all or part of the body of the organism,
population, or community.
1.6.2 Plant biomass is the total amount of dry weight of all parts
of living plants and to facilitate it sometimes divided by plant biomass in
soil bags (leaves, branches, branches, staples) and biomass in the soil
(roots).
1.6.3 Gross primary productivity is the total rate of
photosynthesis, including organic matter that is used up in respiration during
measurement time. This is also known as total photosynthesis or total
assimilation.
1.6.4 Primary net productivity is the rate of storage of organic
matter in plant tissues during measurement time.
CHAPTER II
LITERATURE REVIEW
LITERATURE REVIEW
Biomass is a term for living
weight, usually expressed as dry weight, for all or part of the body of an
organism, population, or community. Plant biomass is the total amount of dry
weight of all parts of plant life. Plant biomass increases as plants absorb
carbon dioxide (CO2) from the air and convert this substance into organic
matter through photosynthesis.
In the mechanism of
coexistence, there is a close interaction between both the individual
vegetation composers themselves and other organisms so that it is a dynamic and
dynamically growing system of vegetation, soil and climate are closely related
and in each place have a specific balance (Hamilton And King, 1988). Unlike
animals, plants make their own food, called primary productivity, which is
divided into net primary productivity and gross primary productivity (Heddy,
1986).
One of the biomass
calculations is the biomass in the lower plants. Underwater plants indirectly
have a role to the absorption of carbon dioxide because lower plants are able
to maintain the moisture so that rapid decomposition process can provide
nutrients for staple crops. Here the nutrient cycle can take place perfectly,
the falling fall as the litter will be returned to the tree in nutrient form as
it is known to be broken down by bacteria (Ewusie, 1990).
Sunlight provides the
energy that drives almost the entire ecosystem, although only other
photosynthetic plants and organisms use this energy source directly. Light
intensity is not the most important factor limiting the growth of terrestrial
plants, but shading by the forest canopy, making the competition to get the
sunlight under the canopy becomes very tight (Campbell et al., 2008). The
process of CO2 absorption by plants is strongly influenced by environmental
factors. Increased soil temperature can stimulate decomposer metabolism
activity to accelerate the rate of mineralization process (organic material
reshuffle into CO2) which will be absorbed by the plant (Repository UPI, 2009).
Estimation of above
ground biomass can be done by two approaches: (i) direct approach by making
allometric equations; And (ii) an indirect approach, using expansion factot
biomass: Despite the advantages and disadvantages of each approach, it should
be noted that the indirect approach is based on a factor developed at the stand
level of the forest with a closed canopy and can not be Used to make estimates
of individual trees (IPCc, 2003). The carbon content of secondary forest
vegetation can be estimated using biomass values derived from allometric
equations or biomass expansion factor (BEF) values in which 50% of the
biomass is stored carbon (Zulkifli, et al, 2010).
There are four main ways
to calculate biomass: (i) in situ sampling by Destructive sampling; (ii)
Non-destructive sampling with in situ forest data collection; (Iii) prediction
through remote sensing; And (iv) modeling. For each of the above methods,
allometric equations are used to extrapolate data snippets to a larger area.
The use of standard published allometric equations is often done, but since the
coefficients of these allometric equations vary for each location and species,
the use of these standard equations can result in a significant error in
estimating the biomass of a vegetation (Sutaryo, 2009).
CHAPTER III
RESEARCH METHODS
3.1 Time and Place Research
The research was conducted on Thursday, April 27, 2017 in Biology
Garden UM.
3.2 Research Method
The method used is the method of least squares with a size of 1m x
1m and 3 replications plot.
3.3 Equipment and Materials
3.3.1 Equipment
The tool used in this
experiment is a grass trimmer, ovens, scales, ordinary scissors, trays, lux
meter, soil analyzer, and a soil thermometer..
3.3.2 Material
As for the materials used
in these experiments are contained in the green grass squares, newspapers, and raffia.
3.4 Methods
1.
Quadrant made from raffia with a size of 1m x 1m is placed at the
sampling location, which had previously been taken at random.
2.
Then the remains of dead plant parts, leaves and twigs fall
contained in each quadrant was taken and set aside.
3.
Grass cut with scissors to the lawn mower out in one of the
squares.
4.
Grass laid on newsprint and labeled in accordance with the code of
the quadrant.
5.
After that, all the grass on newspaper paper neatly wrapped up
solid
6.
Weighed and recorded as wet weight.
7.
Included in the oven at 800 ° C for 48 hours.
8.
After that the dry weight was weighed and recorded in the blank
space provided.
3.5
Data Analysis
Data
were analyzed with the following formula.
Description.
BB =wet
weight
BK =dry
weight
3.6
CHAPTER IV
DATA AND ANANLYSIS
4.1 Data
Table
4.1 Wet Weight and Dry Weight on Each Plot
Day/Date
|
Plot
|
Wet
weight (gr)
|
Dry
weight (gr)
|
Losses
|
20/4/2017
|
1
|
170
|
20
|
150
|
2
|
280
|
30
|
250
|
|
3
|
280
|
20
|
260
|
|
25/4/2017
|
2
|
60
|
20
|
40
|
19/4/2017
|
3
|
20
|
15
|
5
|
Table
4.2 Abiotic factors
Parameter
|
Plot
1
|
Plot
2
|
Plot
3
|
pH
|
7
|
7
|
7
|
Soil
thermometer (oC)
|
25
|
25
|
25
|
Lux
meter (lux)
|
1053
|
1236
|
1316
|
4.2
Data Analysis
Percentage of shrinkage :
% =
Day- 0
Plot
1 =
= 78,95%
Plot
2 =
= 80,65%
Plot
3 =
= 86,67%
Day-4
Plot
2 =
= 50%
Day-8
Plot
3 =
= 14,29%
Weight losses obtained on day 0 of
plots 1, 2, and 3 were 78.95%, 80.65%, 86.67%. While on the 4th day of weight data acquired plot 2 shrinkage by 50%, and severe shrinkage
day 8 at plot 3 was 14.29%.
CHAPTER V
DISCUSSION
Practical
biomass for this time using the method of harvesting is done by cutting part of
the plant that is above the ground level, the plants used are the grass on a
plot size of 1 m x 1 m by 3 plots. Harvesting is done on days 0, 4 and 8.
Harvesting is done in the morning. Parts of plants are cut further weighed.
The
flow of energy in the ecosystem starts during the process of fixation during
photosynthesis. Through photosynthesis light energy is converted into chemical
energy stored by plants organic as stems, seeds, leaves, fruits, tubers, and
others. Amount of energy collected by plants referred to as production or more
specifically referred to as primary production. The rate of energy storage in
plants is referred to as primary productivity. All the energy saved as a result
of the photosynthetic process called gross primary production. Plants also need
a certain amount of energy for life. Energy used for his life is taken from the
photosynthesis through the process of respiration. So the energy stored by
plants after deducting the respiration process called net primary production.
Production is expressed in units of energy / unit area / unit time or unit of
biomass / unit area / unit time. For example Kcal / m2/ year, g / m3/
day, shines the others (Dharmawan, 2005).
Weight
losses obtained on day 0 of plots 1, 2, and 3 were 78.95%, 80.65%, 86.67%.
While on the 4th day of weight data
acquired plot 2 shrinkage by 50%, and
severe shrinkage day 8 at plot 3 was 14.29%. Abiotic factors that measured in
plot 1; pH 7, the soil temperature is 25°C
and light intensity of 1053 lux. In the plot 2 ; pH 7, the soil temperature is
25°C and light intensity of 1236 lux. While the plot 3; pH 7, the
soil temperature is 25°C and light intensity of 1316 lux.
At
the practice this time, it is generally obtained by the weight losses of
harvesting is done. It shows there is a real change in an environment, it is
supported by the theory according to Jordan (1985) in Wiharto (2007) that if
the productivity of an ecosystem has changed little in a long period of time
then it indicates the environmental conditions are stable, but if the changes
dramatically, the show has been a change of a real environment or there were
significant changes in the interaction between organisms constituent
ecosystems.
Meanwhile,
according to Campbell (2002) the difference in biomass in many ecosystems in
the biosphere caused by the presence of a limiting factor in any ecosystem. The
most important factor in productivity restrictions depending on the type of
ecosystem and seasonal changes in the environment. This is made clear by
weather conditions unpredictable plot that is sometimes hot and sometimes rain
even in a day can experience both the weather. Rain causes a fixed amount of
nitrogen in the air, and down to earth with the rain making the land becomes
fertile.
Temperatures
direct or indirect effect on productivity. Direct role in controlling the
temperature of the enzymatic reaction in the photosynthetic process, so that
high temperatures can increase the maximum rate of photosynthesis. Soil
temperature also affects the rate of photosynthesis. Potential availability of
hydrogen is high on tropical soils caused
by organic acids produced continuously through respiration held by soil
microorganisms and roots (soil respiration). If the ground is wet, the carbon
dioxide (CO2) from the respiration of the land and water (H2O)
to form carbonic acid (H2CO3) which will then undergo
dissociation into bicarbonate (HCO3-)and a charged hydrogen ions
positive (H+).The hydrogen ions can then replace the existing
nutrient cations in the soil colloids, then bicarbonate reacts with the cation
released by the colloid, and the result of this reaction can be leached down
through the soil profile (Wiharto, 2007).
Another
factor affecting the biomass is light intensity. Light is the primary energy
source for the ecosystem. This means that the plot was receiving more and more
prolonged sunlight irradiation will have the opportunity to photosynthesize
longer so as to support an increase in biomass. (Wiharto, 2007).
Lower
plants such as grasses serves as a ground cover that keep moisture so rapid
decomposition process can provide nutrients for other plants. Here, the
nutrient cycle can take place perfectly, avalanches are falling as the litter
will be returned to the tree in the form of nutrient elements which as is well
known to be decomposed by bacteria (Ewusia, 1990). Plants such as grasses alike
- each has an influence on the potential of biomass carbon uptake in the
calculation, because the plants in the pasture has an important role in the
carbon storage of photosynthesis (Ewusia, 1990).
Biomass
plants grow because plants absorb carbon dioxide (CO2) from the air and
transform these substances into organic matter through photosynthesis. In the
mechanism of collective life that, there is a close interaction both amongst
individuals vegetation component itself or other organism that is a system that
life-style and dynamically growing vegetation, soil and climate are closely linked
and at each place has a balance of specific (Hamilton and King, 1988)
CHAPTER IV
CLOSING
5.1 Conclusion
1.
Weight
losses obtained on day 0 of plots 1, 2, and 3 were 78.95%, 80.65%, 86.67%.
While on the 4th day of weight data acquired plot 2 shrinkage by 50%, and
severe shrinkage day 8 at plot 3 was 14.29%.
2.
The weight losses of harvesting shows that
if the productivity of an ecosystem has changed little in a long period of time
then it indicates the environmental conditions are stable.
3.
Plants such as grasses alike - each has an
influence on the potential of biomass carbon uptake in the calculation, because
the plants in the pasture has an important role in the carbon storage of
photosynthesis
5.2 Suggestion
1
Practicum must be in accordance with the
appropriate procedures
2
In the reading of the tool should be done
carefully
3
When wrapping grass with newspapers should
be really tight
Bibliography
Campbell, 2002. Biologi
Jilid 3. Jakarta: Erlangga.
Campbell, N. A, Jane B. R. , Lawrence G. M. 2008. Biologi Edisi Kelima
Jilid III. Penerbit Erlangga : Jakarta..
Dharmawan, Agus dkk. 2005. Ekologi Hewan. Malang: Universitas
Negeri Malang.
Ewusia, J.Y. 1990. Pengantar Ekologi Tropika. Bandung : ITB.
Hamilton, L.S dan HLM. N. King. 1988. Daerah Aliran Sungai Hutan Tropika.
Yogyakarta : UGM Press.
Heddy, S., S.B Soemitro, & S.
Soekartomo. 1986. Pengantar
Ekologi. Penerbit Rajawali. Jakarta
Indriyanto. 2006. Ekologi Hutan. Penerbit Bumi Aksara. Jakarta
Jordan, C.F. 1985. Nutrient
Cycling in Tropical Forest Ecosystem. UK : John Wiley & Sons. Ltd.
Odum, E. 1993. Dasar-dasar Ekologi. Yogyakarta : UGM Press.
Repository UPI. 2009. Hasil dan Pembahasan Biomassa. Universitas Pendidikan
Indonesia. Bandung
Resosoedarmo, S., K. Kartawinata, dan A. Soegiarto. 1986. Pengantar
Ekologi. . Bandung : Redmaja Rosda Karya.
Soemarwoto, O. 1983. Ekologi Lingkungan Hidup dan Pembangunan. Jakarta :
Djambatan.
Sutaryo, D . 2009. Perhitungan Biomassa (Sebuah Pengantar Untuk Studi Karbon
dan Perdagangan Karbon.
Bumi Aksara : Jakarta.
Wiharto, M. 2007.
Produktivitas Vegetasi Hutan Hujan Tropis. (Online).
(http://www.geocities,com/roykarpet/produktivitas_hht.) diakses tanggal 10 Mei
2017
Zulkifli, H., Yustian, I. Dan Setiawan D. 2010. Kandungan Karbon
Tersimpan Dalam Serasah Sebagai Mitigasi Dampak Perubahan Iklim Perkotaan.
Sriwijaya Press : Palembang.
BIOMASS
Practicum Reports
Prepared to fulfill
duties of Ecology course
Lectured by Mr. Dr.Hadi
Suwono, M.Sc. and
Mrs. Dr.Vivi Novianti,
S.Si, M.Si.
By:
Group 4 / Offering A
1.
Aisyatur
Robia (150341600791)
2.
Lelly
Luckitasari (150341600339)
3.
M.
Hisham Baidlowi (150341600339)
4.
Najatul
Ubadati ( 150341603981)
5.
Nor
Azizah (150341603981)
STATE UNIVERSITY OF
MALANG
FACULTY OF MATHEMATICS
AND NATURAL SCIENCE
DEPARTMENT OF BIOLOGY
May 2017


Nice information Ais, hehe
BalasHapusSaya sangat membutuhkan informasi ini untuk menambah pemahaman saya mengenai biomassa